An A-Weighted Analog Filter that Mimics the Response of the Human Ear
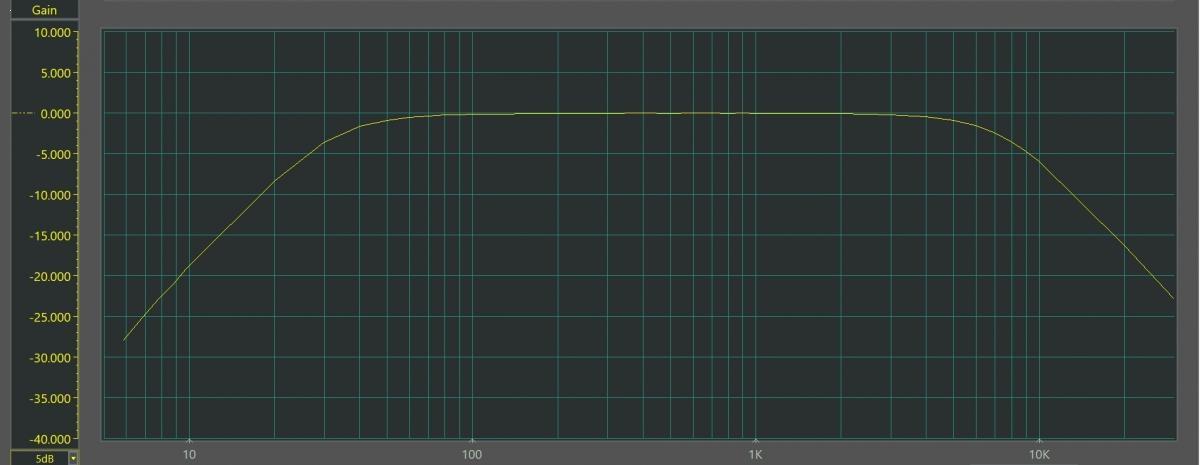
In my previous article in this series, I demonstrated the design of an unweighted (Z-weighted) audio filter with a flat frequency response to measure audio noise and use with the wideband analog voltage and current meter. That flat response is interesting but doesn’t tell us how people would perceive audio noise.
Outside of audio and acoustics circles, the A-weighting filter response and its history are not widely known. To explain A-weighting, we start with two facts about the sensitivity of the human ear:
- It varies with frequency.
- It is dependent on sound pressure.
Sound pressure is a physical quantity usually expressed as sound pressure level (SPL) in newtons per square meter. A newton is the gravitational force on a small apple that weighs 98.1 grams. The range of interest for SPL is well over ten million, so it is usually in decibels referred to 20 µPa as dB(20µPa).
This 20 µPa reference level is not entirely arbitrary. It is approximately equivalent to a sound intensity of 1 pW/m2 and the threshold of hearing at 1 kHz (the average quietest sound that humans can hear at 1 kHz).
The result of the two variations (frequency and sound pressure level) is that the subjective loudness of signals at different frequencies and levels varies considerably. The first scientific publication on this subject appears to date from 1921. Unfortunately, the title and publication could not be found, perhaps because its conclusions were quickly found to be over-simplified. An early scientific publication on this subject dates from 1927 and covers only the frequency range of 40 Hz to 4 kHz. (Kingsbury B A, “A Direct Comparison of the Loudness of Pure Tones,” The Physical Review, Vol 29, April (1927).
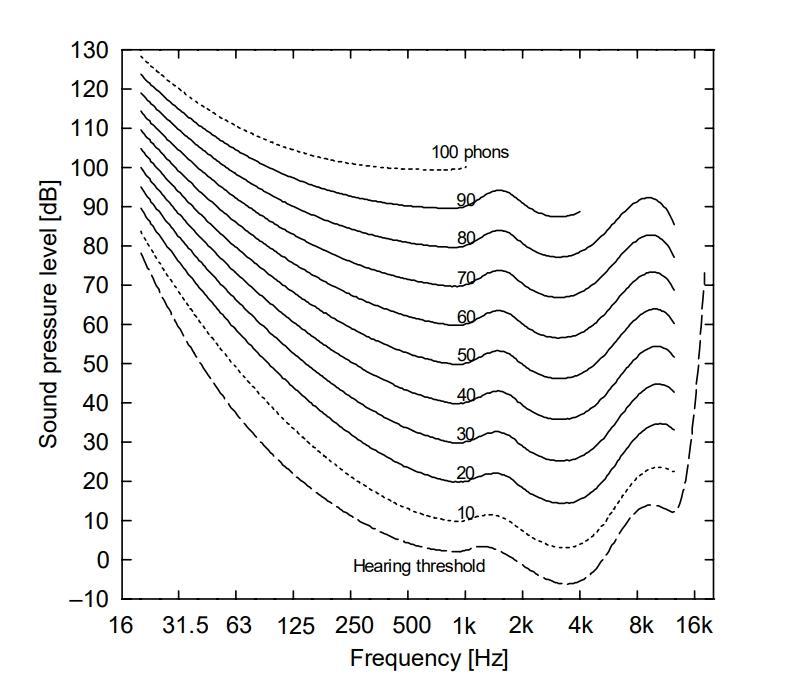
Perceived audio loudness is expressed using the measurement unit phon. The definitive equal loudness contours are provided in ISO standard ISO 226:2023 and shown in Figure 1.

Figure 1. Equal loudness contours as a function of frequency and sound pressure level.
It is well-known that ‘noise annoys', so if we are going to measure noise, we have to take into account that very low-frequency sounds will need a greater sound pressure level to be heard as loud as, say, a 1 kHz signal.
Therefore, the measuring instrument (a sound level meter or an audio voltmeter) must have less gain at low frequencies if it will match human perception. The first attempt at this proposed a filter that matched the 40-phon contour (or rather the inverse of it), but that was later changed to the 60-phon contour. Figure 2 shows the inverse contours and the A-weighting curve specified in IEC standard IEC 61672-1: 2013.
Figure 2. Inverse 60-phon loudness contour (red) compared to the A-weighting curve (blue). (Click image to enlarge)
Figure 3 shows that the match between the 60-phon contour and A-weighting is quite good up to 2 kHz but not above.
Figure 3. Deviation of the A-weighting curve from the 60-phon loudness contour. (Click image to enlarge)
Extending the matching to higher frequencies using analog filter technology would be very difficult, but it could be done with digital filter technology. However, the mismatch is only found in practice to be a problem if there are prominent tones in the noise at or near the frequencies of maximum error, which is unlikely.
What is C-Weighting?
C-weighting is a flat response with -3 dB gain from 31.5 Hz to 8 kHz. It approximates the band of frequencies that is significant in environmental noise. When building an A-weighting filter, we can also add a C-weighting filter at only the cost of one switch and some resistors.
How to Design an A-Weighting Filter
Unlike a response requirement based on physics, we are attempting to match the response curves based on messy biological effects. Using only a number of simple dB/octave filter sections will not work.
Using a Poor Second-Order RC Filter
By a process of curve matching, it was found that a ‘poorly-designed’ second-order RC filter is needed, in addition to the two simple filter stages required for the C-weighting curve. What is poorly designed about the RC filter is that it consists of two equal passive sections connected in cascade with no buffer between them. The loading of the first section by the second section considerably alters the response in the cut-off (low attenuation) frequency range.
Figure 4 shows the effect in a simple LTspice simulation. The black curves are for the buffered filter on different decibel scales, while the red curves are for the unbuffered version, giving the ‘soggy’ response that is needed.
Figure 4. Special second-order passive filter. (Click image to enlarge)
From Figure 4, it can be seen that with the buffer (OUT1), the -6 dB (two contributions of –3 dB) frequency is 283 Hz. The unbuffered filter (OUT2) has its -6 dB point at 441 Hz—quite a difference—and the cut-off curve is much flatter.
To complete the whole filter, we need to add a normal second-order high-pass filter with a -3 dB point at 31.5 Hz and a second-order low-pass filter with a -3 dB point at 8 kHz. This information is conveniently included in IEC 61672-1:2013.
Figure 5 shows the resulting circuit schematic. It’s quite OK to use TL071, TL072, or TL074 op amps, because of the limited frequency range and the low Q of the active filters.
Figure 5. The complete A- and C-weighting filter designs. (Click image to enlarge)
Passive Component Selection and Adjustment
To get a good match to the standard frequency response curves, ±1 % tolerance components are really necessary. This is no problem for the resistors and, maybe, the 1 nF capacitors. However, the 28 nF (27 nF and 1 nF in parallel) and 47 nF capacitors need selection. It may be necessary to use 22 nF and 39 nF parts with smaller ones in parallel to create the desired values.
For the A-weighting filter, the 4.4 kΩ resistor (made using two 2.2 kΩ in series), the 5.1 kΩ resistors, and the track resistance of the 2.5 kΩ preset pot make up the 12 kΩ resistance required by the filter. The total resistance must be within ±1 % of 12 kΩ, achieved by adjusting the values of the series resistors. The preset pot allows for variations of the gain of the three filter sections.
For the C-weighting filter, the 2.5 kΩ preset pot allows for variations of the gain of the two active filter stages. The 7.8 kΩ resistor is two 3.9 kΩ in series, and the 6.0 kΩ resistor is 2.7 kΩ and 3.3 kΩ in series. The total resistance of the chain is not critical.
The preset pots are adjusted so that with the filter inserted in the wideband voltmeter, a 1 V input signal at 1 kHz produces an output reading of 1 V.
Simulated A- and C-Weighting Filter Responses
Figure 6 shows the measured frequency response of the A-weighting filter, while Figure 7 shows how well it meets the specifications in IEC 61672-1:2013. The uneven trace below 20 Hz in Figure 6 is due to the filter capacitors charging when the sweep starts.
Figure 6. Measured frequency response of the A-weighting filter. (Click image to enlarge)
Figure 7. Comparing the measured A-weighting frequency response with the standard. (Click image to enlarge)
Figure 7 shows that if we pay careful attention to the component values, the filter can meet even the Class 1 frequency response specification.
Figure 8 shows the measured frequency response of the C-weighting filter.

Figure 8. Measured frequency response of the C-weighting filter. (Click image to enlarge)
What’s Next?
In this article, we have examined the design of a noise filter that approximates the biological response of the human ear to sounds at different frequencies. This A-weighting filter provides less gain at lower frequencies to mimic typical human perception of noise.
In a future article, I plan to explore one more external filter for use with our wideband voltmeter—the ITU BS.468-4 noise-weighting filter. This filter, used with a peak-reading meter, measures the disturbing effect of noise, especially clicks, on program signals, not the noise level itself. It is often used for measuring professional audio equipment performance.

